Unless otherwise noted, all content on this page is created by and copyright Frank S. Li. Please do not reproduce without permission.
Table of Contents
Introduction
Data Sources and Management
Statistics
Accessibility
Scenario Modeling
Limitations and Future Analysis
Personal Note
Introduction
Despite our society’s continued trend towards digitization and the dominance of the internet, the physical library continues to have an important place in the community as a meeting space, technological resource, and cultural center. They are especially of potential value to young people, of approximately middle and high school age, offering recreational reading, educational materials, and computer access in a safe public space.
This study is aimed at the relationship between area demographics and public libraries, with special focus on potentially under-served populations. It therefore examines libraries in the context of the 10-17 age range and minority population demographics in the greater Boston metro area. It will first examine the relationships between libraries per municipality and municipal demographics and the relationship between individual library circulation and local demographics using statistical regression methods. Then it will examine accessibility along demographic lines in view of transit lines and public schools using proximity analysis. Finally it will model some potential areas for new library development to address the accessibility issues and the impact these new locations might have.
This study hopes to answer:
1. What demographic is most strongly associated with library prevalence and size? Why might this be?
2. What populations have the least access to either public libraries, public high schools (and their libraries), or transit access to either of the above?
3. What are some areas where a potential new library branch would assuage the accessibility problems discovered in question no. 2?
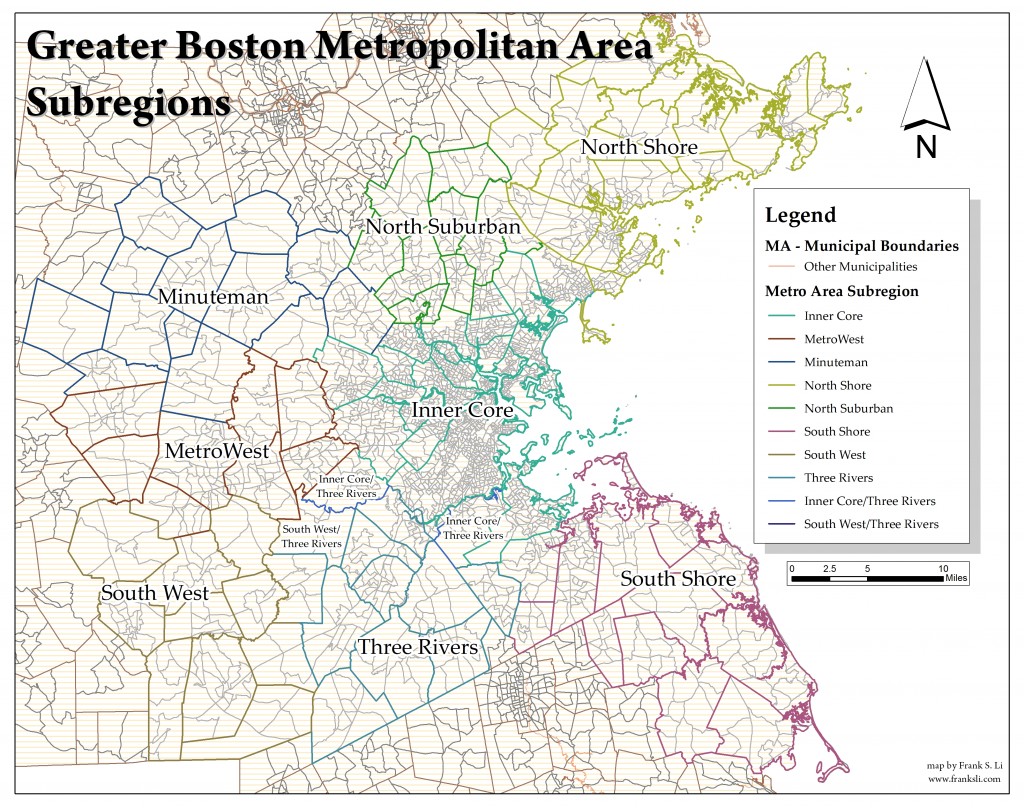
The following is a map of the study area and its subregions:
Data Sources and Management
All spatial data acquired from MassGIS, including municipal boundaries, census block groups, transit lines and nodes (bus, rapid transit, and commuter rail), library point locations, and K-12 school point locations. Other features used in these maps are created from geoprocessing one or more of the above. http://www.mass.gov/anf/research-and-tech/it-serv-and-support/application-serv/office-of-geographic-information-massgis/datalayers/
All demographic data is from the 2011 American Community Survey 5 Year Estimates by block group. Municipal level numbers were gained via spatial join. https://www.census.gov/geo/maps-data/data/tiger-data.html
Library circulation data is from the Massachusetts Board of Library Commissioners data. http://mblc.state.ma.us/advisory/statistics/public/
Statistics
What demographic is most strongly associated with library prevalence and size? Why might this be?
(Since all of the explanatory variables in question are demographic, this study uses only a single variable per regression function due to definite and significant multicollinearity between variables.)
This study examines several demographic variables in terms of their relationship with libraries in the greater Boston metropolitan area. These variables are as follows:
1. population from ages 10 to 17
2. population of ages 18 and higher
3. ethnic minority population (defined as anything besides “white only”, including two or more races)
4. “white only” population
5. female population
The first set of regression analyses (Ordinary Least Squares) was run at the municipal level, with library count (including both public and secondary school libraries) as the dependent variable and each of these demographic values as the explanatory variable. Given that higher population is generally correlated with more schools and more services to provide for the increased population, it is no surprise that all of these demographic subsets yielded strong results.
Coefficient: the slope of the regression line of best fit; or, adding one unit (person) to this category results in this many more libraries.
Coefficient significance: is the coefficient statistically significant?
Multiple r^2: coefficient of determination and a measure of goodness of model fit. The subset explanatory variable can be said to explain this percent of the change in the dependent variable (e.g., total population accounts for 98.231% of the change in municipal library count).
Akaike’s Information Criterion (AICc): a measure of model goodness of fit. Lower values are better, but acts only as a relative measure – there is no absolute “good” or “bad” number.
Jarque-Bera Statistic Significance: if this test is statistically significant, then the model’s predictions are biased (the residuals are not normally distributed).
As is evident and to be expected, all of these demographic markers display a high degree of statistical significance and fairly similar Multiple r^2 and AICc values. There is still some variation, however, and it makes sense. For example, Aged 10-17 has the lowest Multiple r^2 value and the highest AICc. Public libraries and public schools are both that – public. Since children are not generally running about paying taxes, it follows that their presence does not lead directly to more public funds available to pay for these services. On the other hand, Aged 18+ has the highest Multiple r^2 value and the lowest AICc, for the opposite reasons.
The two numbers most worth noting here are the coefficient for Aged 10-17 and the values for the Female demographic at large. While Aged 10-17 is the model of the six that fits least well, it has by far the highest coefficient. This means that more children of that age range have a larger magnitude of effect on the municipal library count than any of the other factors. This may be due to a wealth or stage-of-life disparity; children of that age are rarely on their own, and their parents are likely at a further (and presumably wealthier) stage of life than the average. The relatively low model fit may be due to the influence of this external variable.
The Female demographic is most interesting in comparison to their male counterparts. Though not listed here specifically, the Female demographic has a higher coefficient, a higher Multiple r^2 and a higher AICc values than the Total Population demographic. This merely suggests that women may have a slightly more pronounced effect on municipal library count than men do.
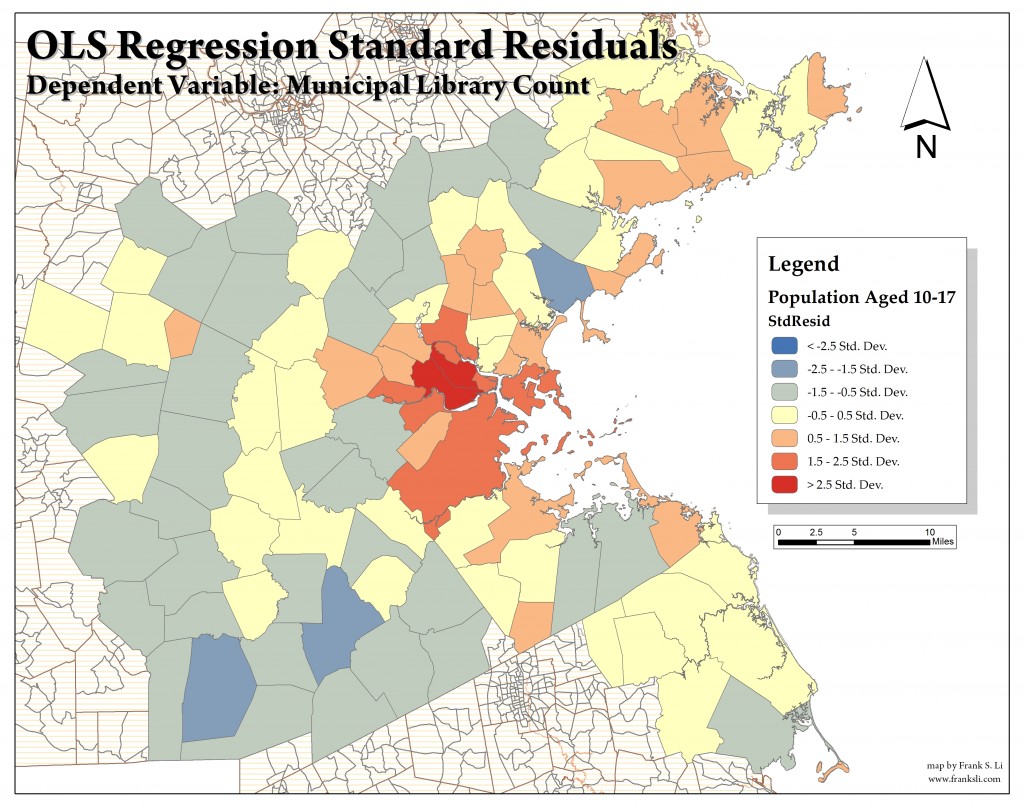
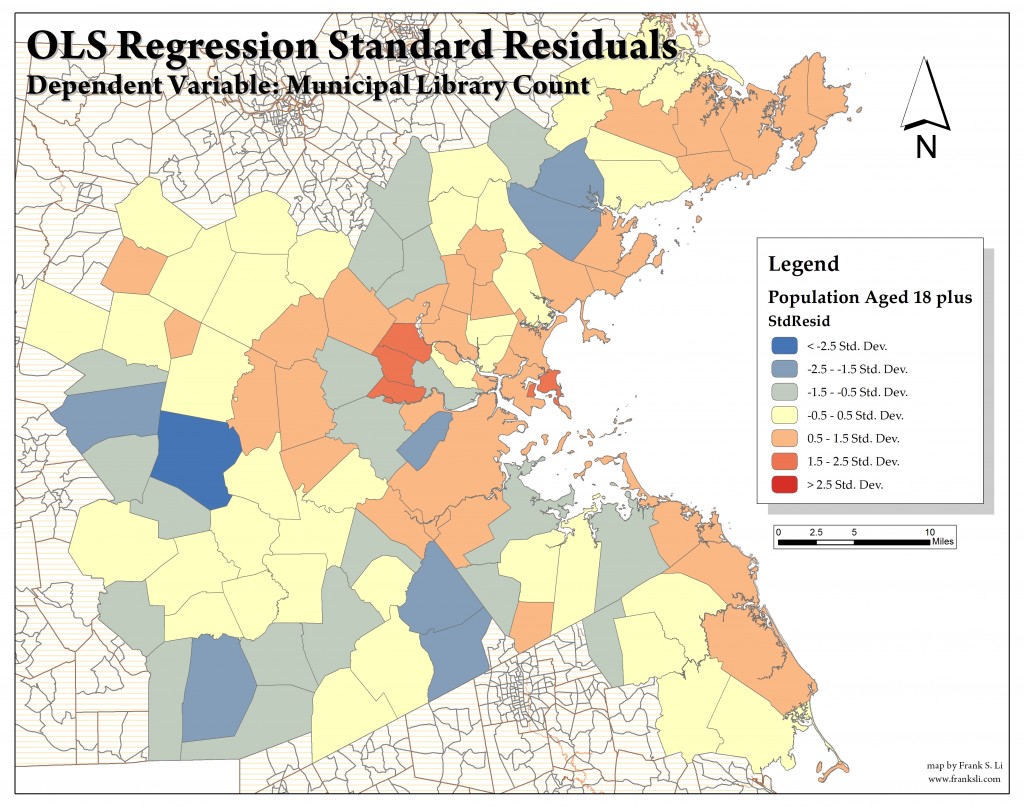
The following maps are of the standard residuals for Aged 10-17 and Aged 18+ from this regression analysis.
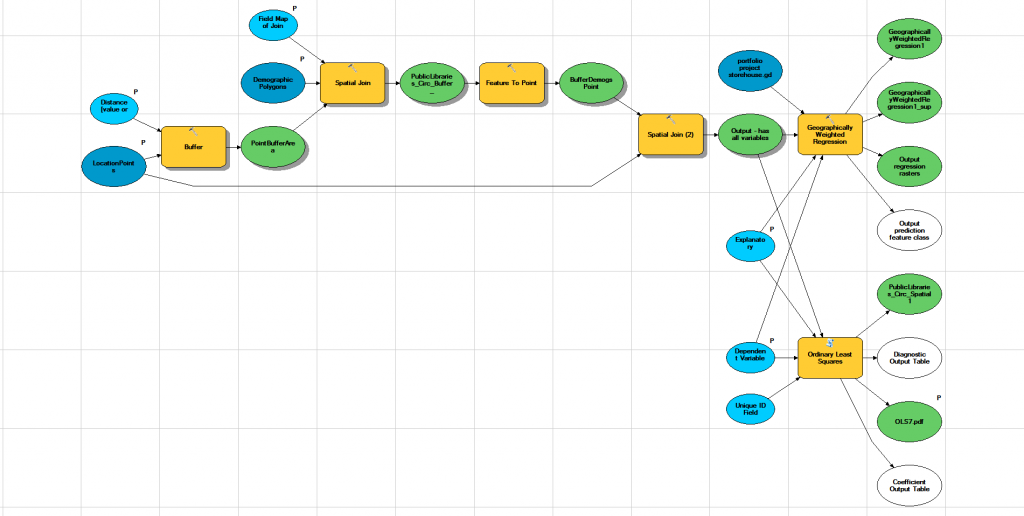
The next set of OLS regression analyses was run at the local level, examining those same demographics variables. However, instead of examining libraries by count at the municipal level, this set examines library direct circulation (meaning over the counter, physical circulation and excluding inter-library loans) in the context of the demographics of each library’s immediate surroundings. Since circulation data was only available for public libraries, public school libraries were not included in this step. I used the following model workflow to arrive at this data.
Note: buffer distance of 0.25 miles.
The following table contains the resulting statistical data from this round of OLS regression.
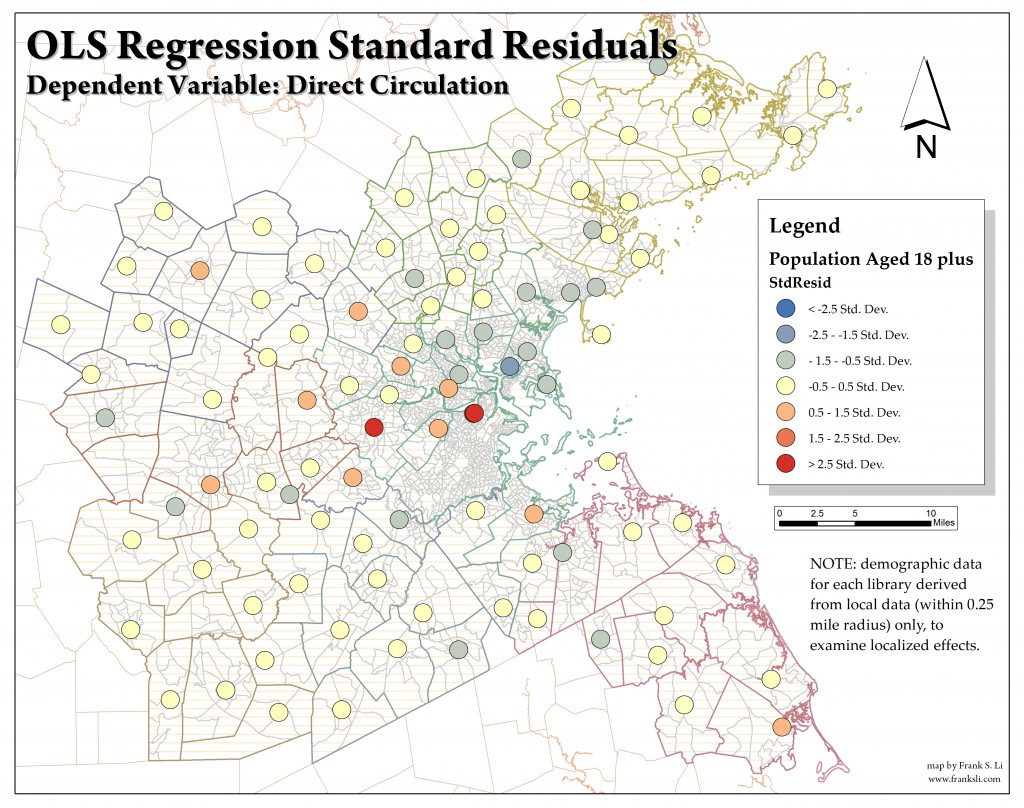
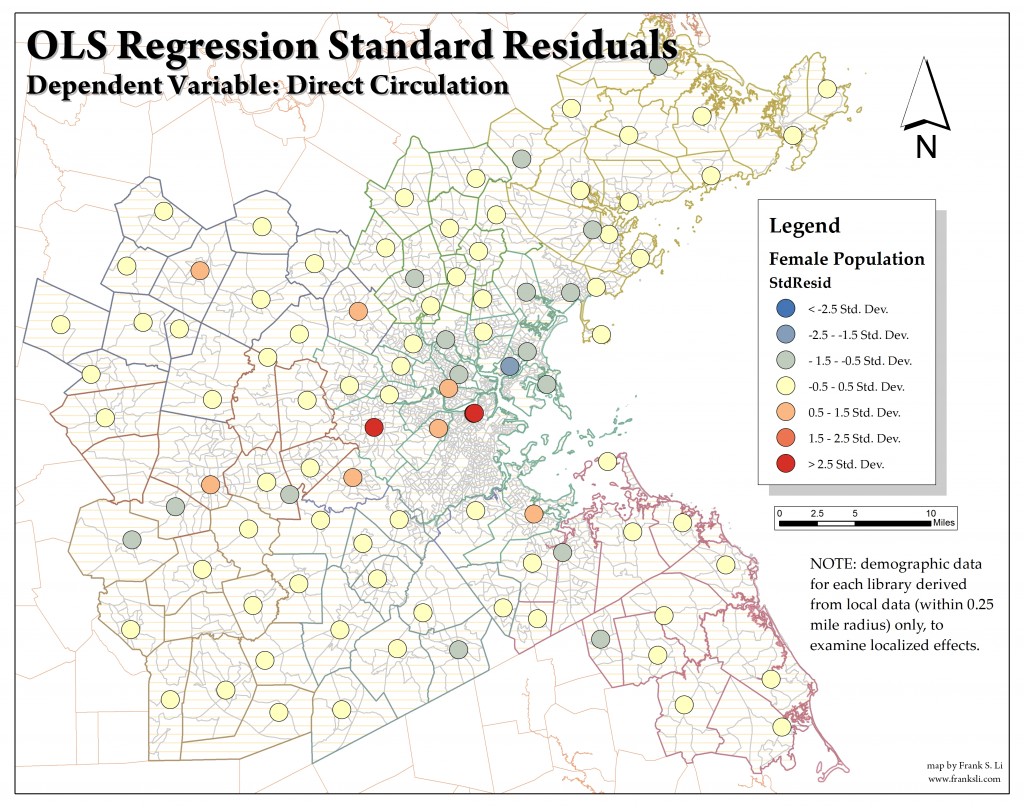
The first and most important thing to note here is that we do not have a statistically significant coefficient for Aged 10-17 in this analysis. The issues brought up in consideration of the first set of OLS analyses may well be a major factor here; as well, since this set of regression analyses is limited to the immediate surroundings of a given public library, the presence and influence of well-to-do families in the suburbs on these results is likely diminished. Otherwise, despite much lower Multiple r^2 values, the patterns more or less hold as before. The differences are now more pronounced, however; for example the minority demographic is able to explain far less of the variation in library direct circulation than the other four statistically significant variables. As well, insofar as local demographic variation is concerned, the female demographic has by far the greatest magnitude of influence on library direct circulation of these five variables – though the Aged 18+ demographic variable remains the best fitting model.
The following maps are of the standard residuals for Aged 18+ and Female from this regression analysis.
Finally, in order to examine the influence of regional variation more closely, I performed two Geographically Weighted Regressions (GWR) on the library points from the second set of OLS regression: once each with Aged 18+ and Female as the explanatory variables. This tool allows the regression function to vary at each feature based only on the attributes of its neighbors, rather than at the global level. The resulting coefficient raster surfaces show any regional variation in the coefficient of the regression functions, allowing us to see if there are certain areas where a change has a significantly larger effect than another.
(GWR coefficient raster surfaces forthcoming…they’re kind of boring to look at, so don’t worry: you’re not missing much)
Both raster surfaces seem fairly uniform. There seems to be a fairly minor trend toward the south or southwest, into the South Shore region, but given the absolutely miniscule ranges in coefficients here it is evident that regional variation is not a factor.
Accessibility
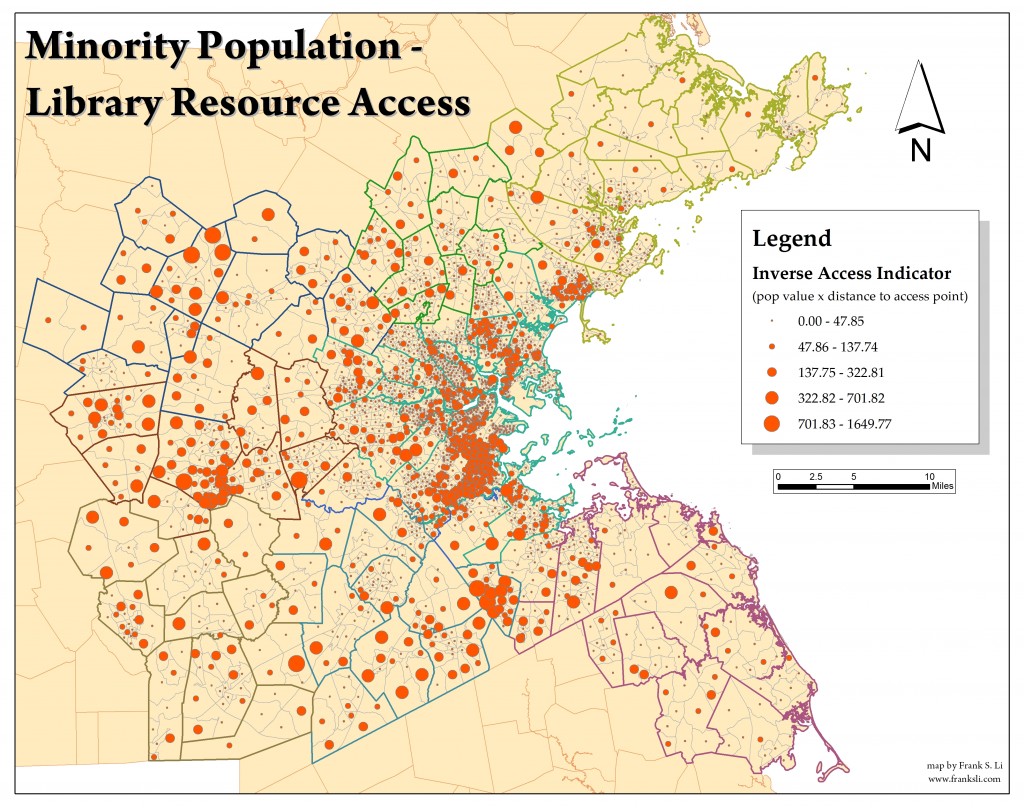
Having fantastic libraries is meaningless if the populations cannot easily reach them. This study models accessibility by direct proximity to resources and concludes that within the extent of the study, the minority population (defined as not “white only”) is the most under-served population insofar as accessibility is concerned, especially as we get farther from the urban core. Randolph and much of the rest of the south Three Rivers region, Framingham in the MetroWest region, and Acton in the Minuteman region are notable. Significantly, Waltham, Newton, and Brookline in the inner core seem to be lacking in accessibility as well.
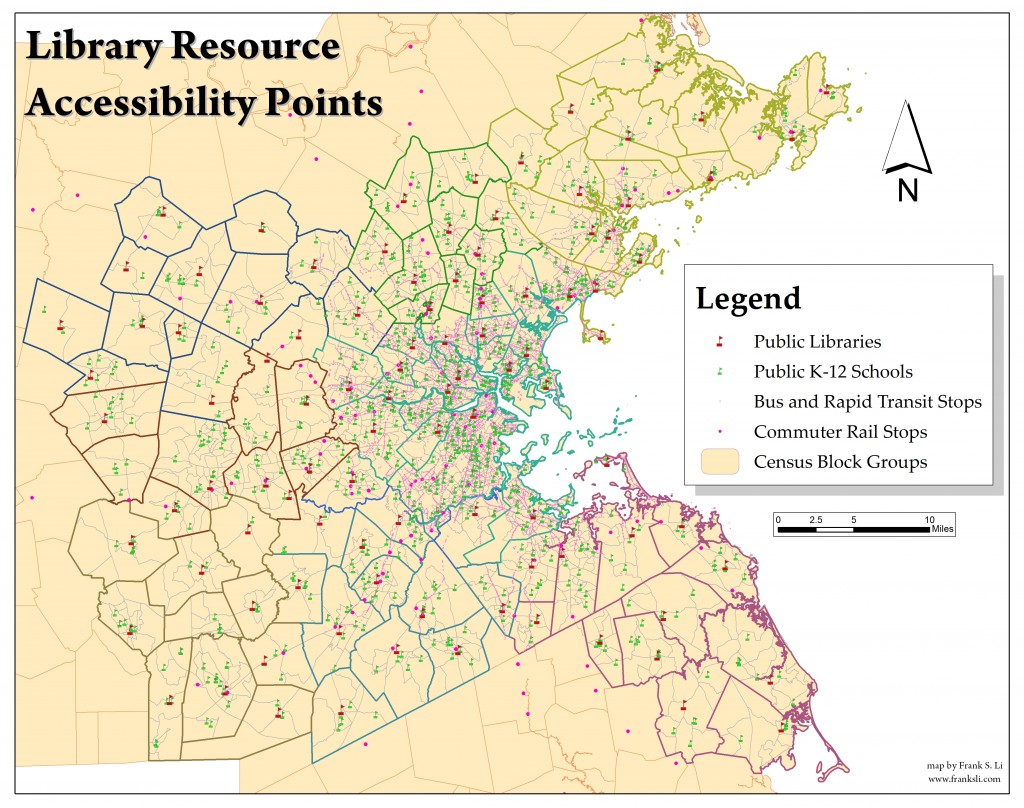
This study defines that the farther you live from a resource or transit able to bring you to the resource, the less accessible that resource is to you. It uses proximity to the centroid of each block group as its measure, and counts as public libraries, public K-12 schools, bus stops, commuter rail stops, and rapid transit stops as of equal magnitude. This method generalizes that the closer your block group is to any of these features, the better public library access you have (see “Limitations and Future Analysis” section for further commentary).
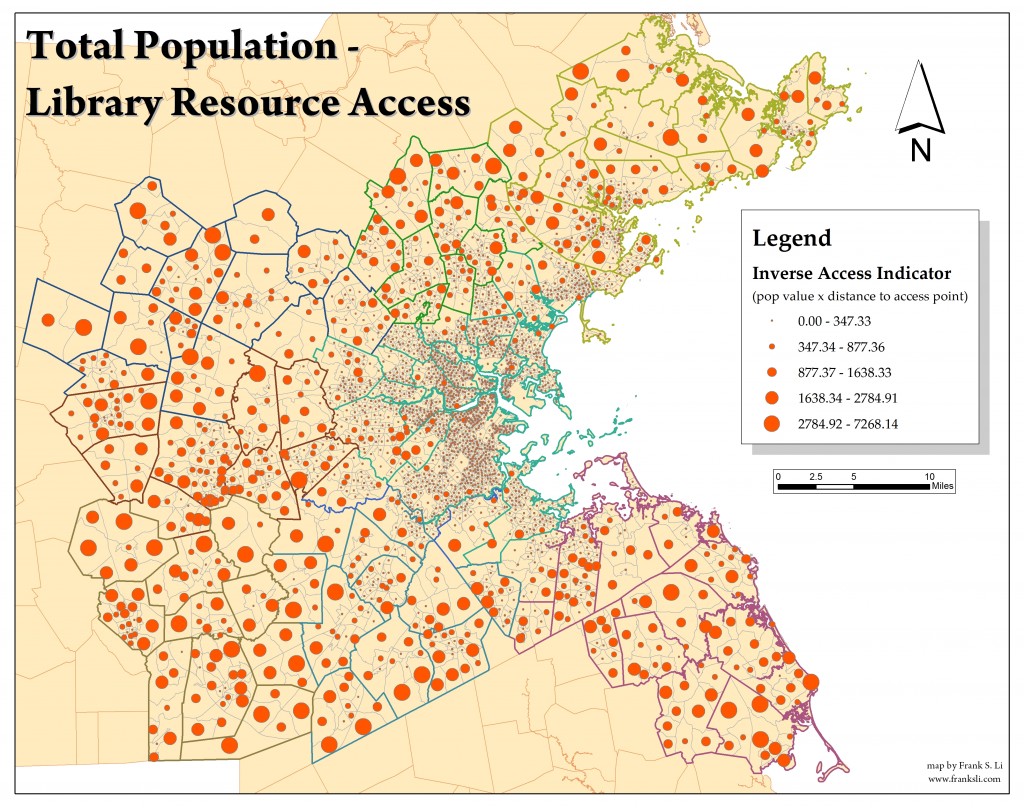
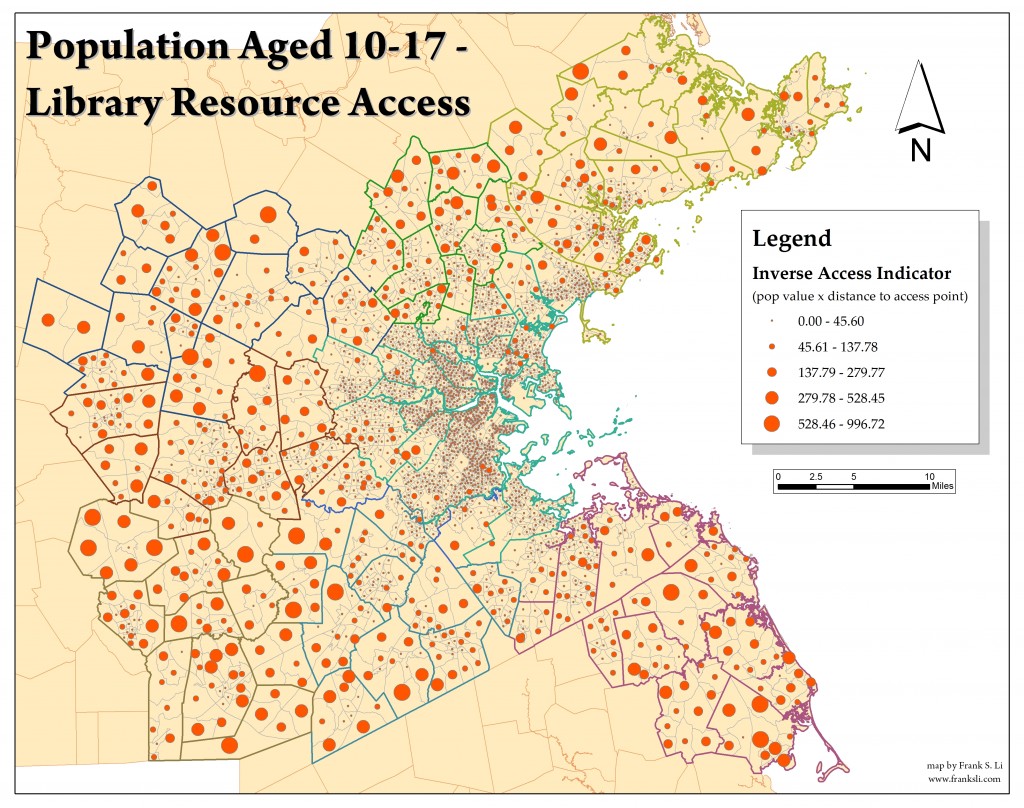
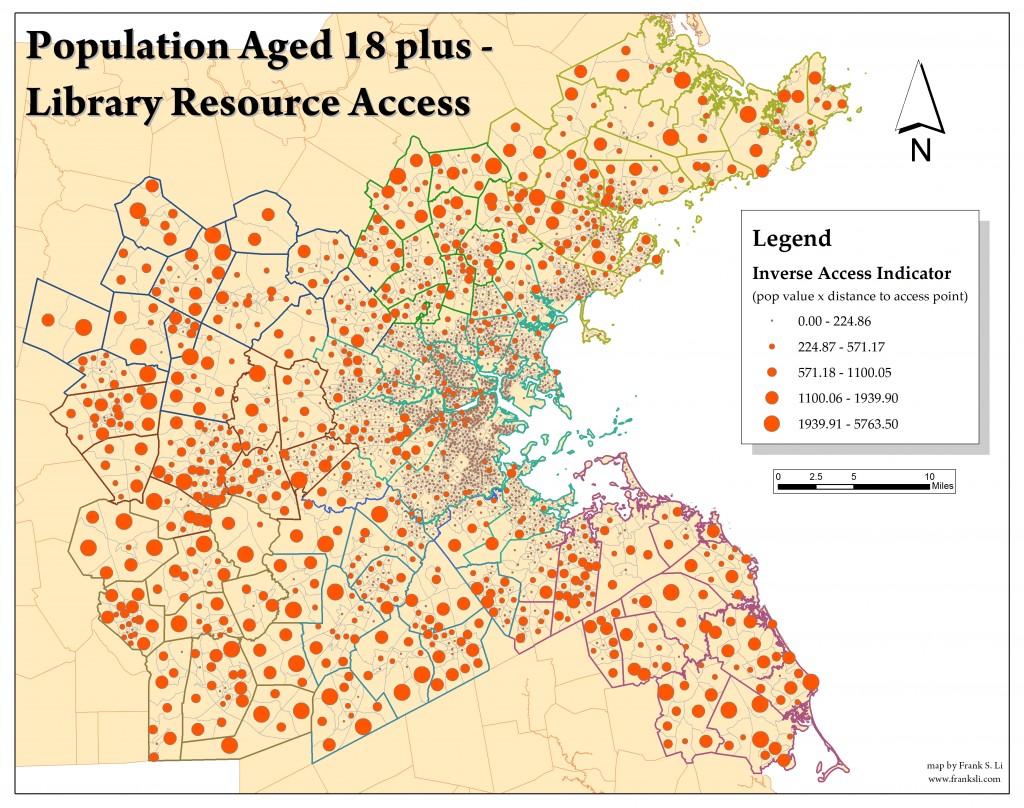
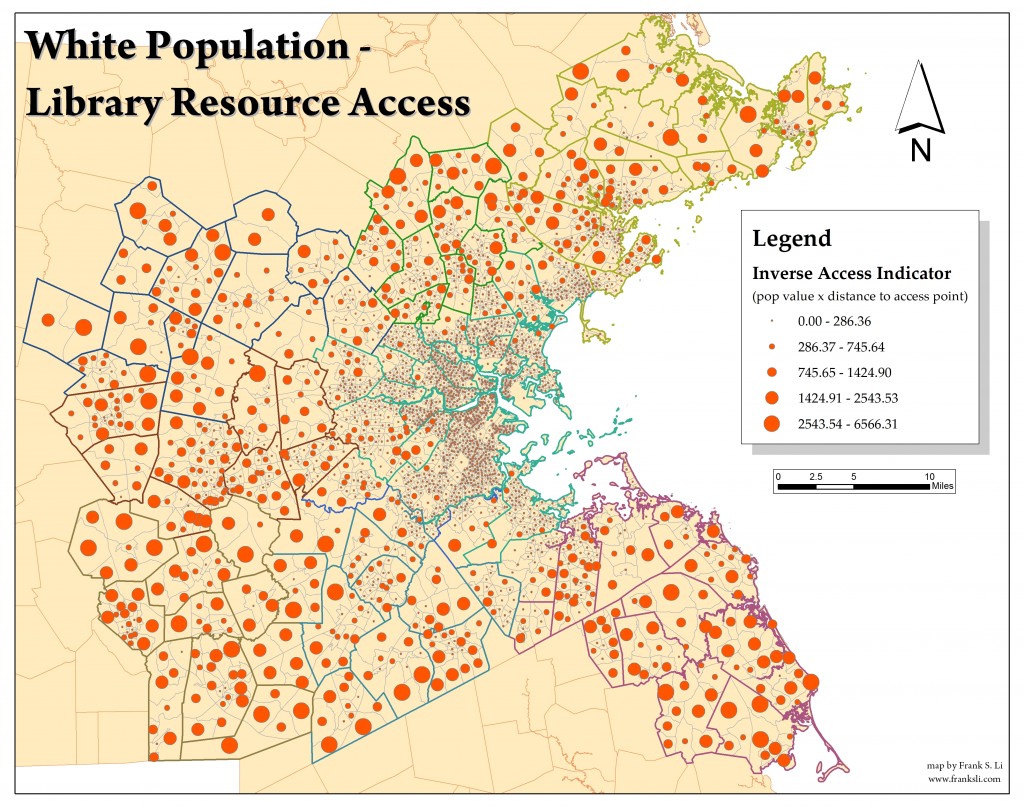
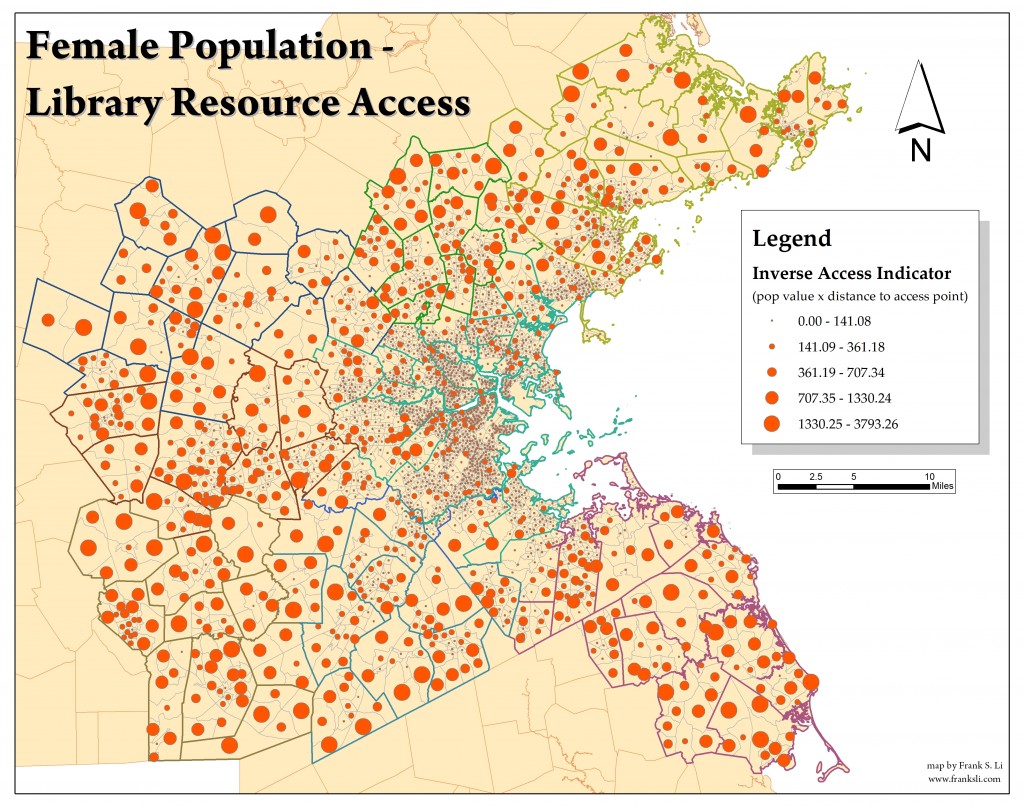
Next, to create an easily mappable indicator for each demographic, the population value of that block group is multiplied by the distance to the closest access point. This indicator shows inverse accessibility; the higher it is, the less access that population has. In this way, we can generalize that the large populations that are far away have greater indicator values and small populations that are close by have smaller ones.
(population of demographic in question) * (miles to closest access point) = (inverse access indicator value)
The following map shows the census block groups and all the access points used in this analysis.
The five demographic subsets examined in this way here are: all persons aged 10-17, all persons aged 18 plus, all persons who ethnically identify as something besides “white only”, all persons who ethnically identify as “white only”, and all persons who are women. As a baseline, the first map below symbolizes this accessibility indicator for total population, followed by the five subsets in question. Note that since these values are not yet normalized, the legend scales are inconsistent; these maps only show relative access compared to other groups of the same population subset.
Finally, to show overall regional accessibility, the indicator values are normalized to have the same mean access indicator value as the total population measure. The residuals are then calculated between the total population and the subset population values, which are then summed for an overall comparative value across the five demographic subsets. In this way, differences in both magnitude of subset population and regional variation are normalized. These values are summarized in the following table:
*all numerical values in this chart have six decimal places, excepting the residuals ranges which have three. Since the accessibility indicator value is an inverse one – higher values mean less accessibility – a higher residuals sum means less accessibility overall.
From these values we can see that, overall, the minority (again, defined as not “white only”) population has the highest normalized accessibility difficulties.
Scenario Modeling
(this section forthcoming)
Personal Note
I’m old enough to remember the days before the internet, when we still had the Macintosh, 3.5 inch floppy disks (and even the 5¼ inch), and land lines. I distinctly remember booting up Windows 3.1 from MS-DOS. However, I’m also young enough that the internet has been the defining technological force on my life. I’m one of those “Generation Y” kids, who used to play Neopets and use AOL Instant Messenger and adopted Facebook early (although I don’t have time to play games anymore).
Despite all of this, the physical library has been and continues to be perhaps an even more insidious force on my life. Perhaps I’m simply just old enough to feel a bit neo-Luddite about recent technological advances; I don’t have a smartphone and refuse to use Twitter, Instagram, Vine, or whatever the most recent social media outlet is nowadays. But something about the physicality of the library, of a real book, of that palpable collection of knowledge and ideas, draws me. Online we search for what we already know we want; in a library we go to a section and start browsing. Even better – libraries don’t arrange themselves by popularity or relevance, making possible the chance encounters that have led me to some of my favorite books.
Nowadays by necessity I use the internet for most of what I do, and while doing research having the search function is invaluable. But I read for entertainment whenever I can, and truly those moments are some of the greatest pleasures of my life. And even though I own and use an e-reader, I prefer physical books whenever possible and fervently hope that libraries will never truly disappear.
